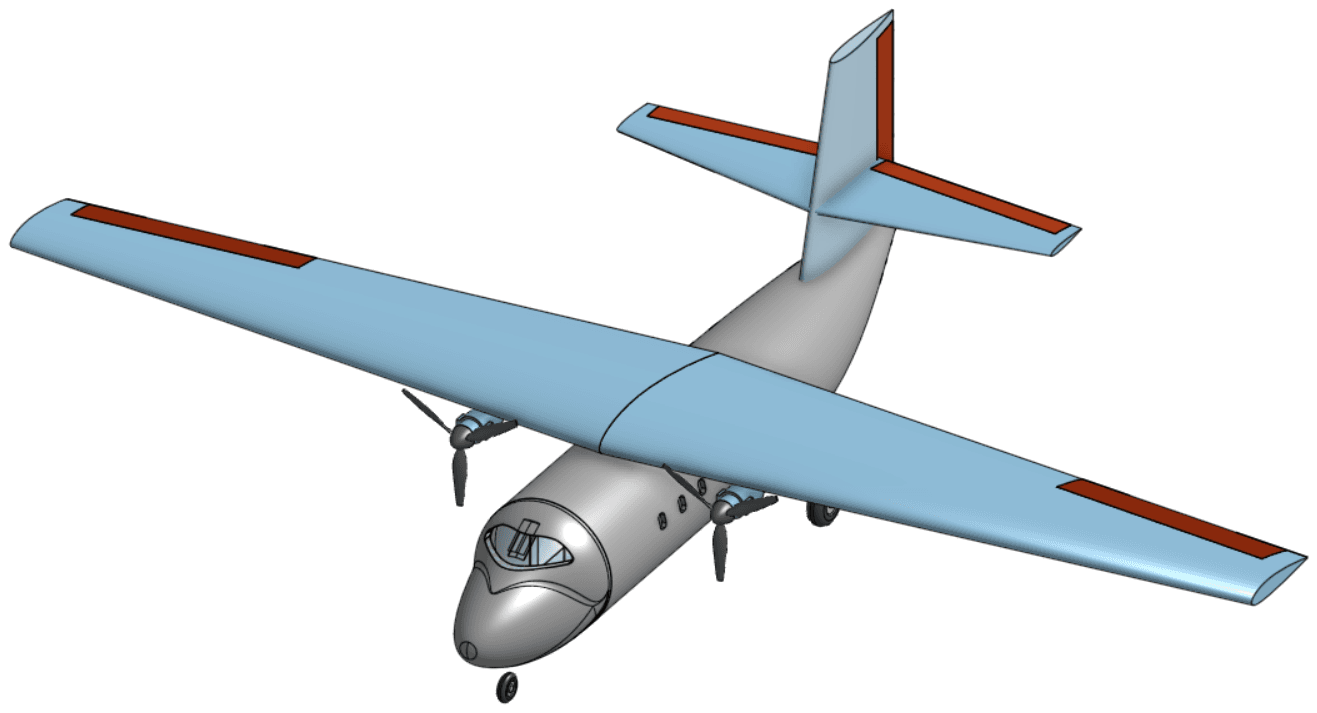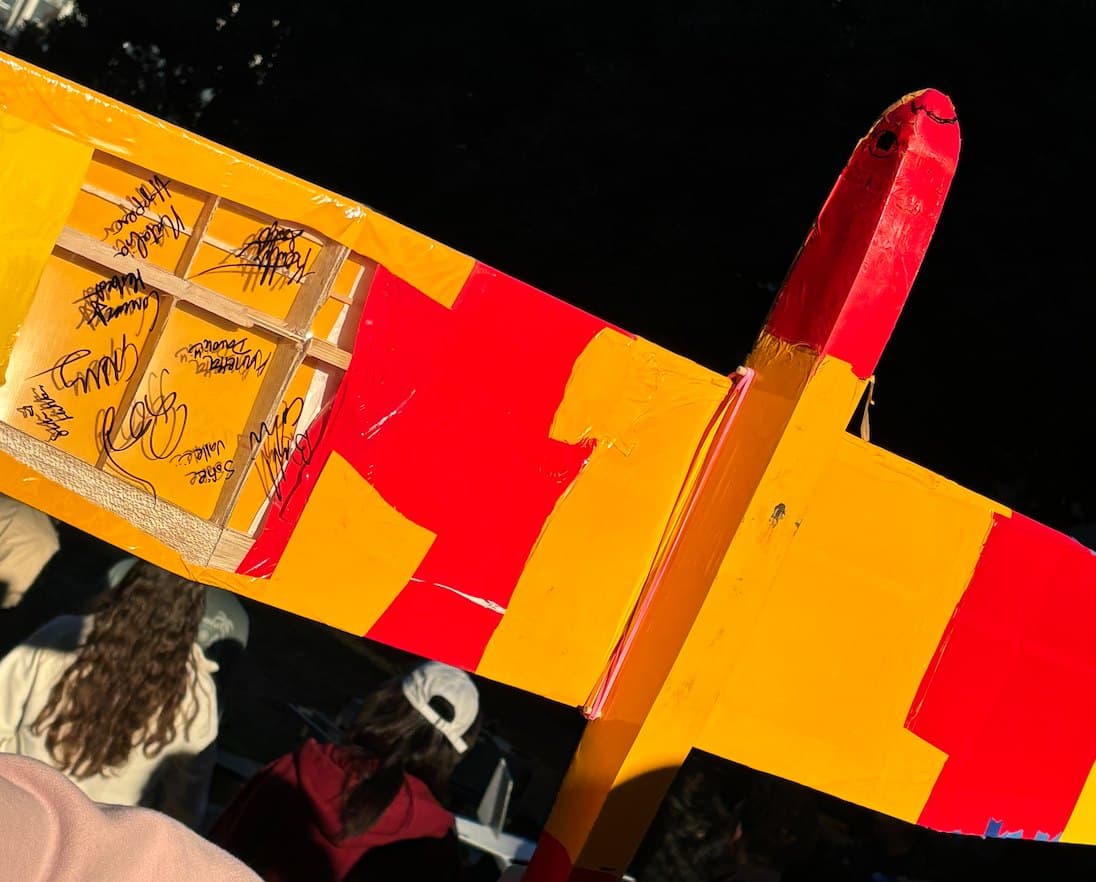
As-built Phoenix — 1.21 m NACA 6415
P-01Glider design and flight-test campaign
Phoenix
Fall 2024 · delivered 5 December 2024
RoleWing structure, flight-test reduction, and MATLAB drag buildup · 6-person team SNACKS — I did most of the wing structure; teammates built the fuselage
Design, build, and fly a 1.21 m glider, then prove the polar with instrumented launches. I took the wing; the fuselage was a team effort. The question was not whether it would fly — it did — but why the first four shots veered right and fell short of the MATLAB range curve.
Technical execution
- Wing structure. I did most of the wing structure (NACA 6415, b = 1.21 m, c̄ = 0.215 m, AR = 5.63, S = 0.269 m²) while teammates built the 0.89 m fuselage. I used that as-built geometry in the drag buildup, not the sketch mass.
- MATLAB drag buildup. I assembled D = D0 + Di with laminar/turbulent Cf, Oswald e from AR, and CL ≈ W/qS. Pre-flight polar assumed 0.60 kg and 2.00 m launch; I rebuilt it on the pad at 0.85 kg, 1.75 m, ρ = 1.24 kg/m³.
- Seven-flight campaign. I reduced speed, duration, X-range, and mass for each shot. Video clocks gave time; tape and clay on the left wing and stabilizer were the only in-field mass properties I changed.
- Close the polar with flight data. Theory peaked near 7.6 m/s and 22–24 m. Flight 7 ran 9.2 m/s and 29.5 m. I backed experimental (L/D)max = R/h = 29.5 / 1.75 = 16.9 and compared it to the 4.79 and 21.14 book values from two CD,0 estimates.
Outcome
- The vehicle flew — seven instrumented launches, Rmax = 29.5 m on flight 7 at 9.2 m/s.
- Experimental (L/D)max = 16.9. Mean experimental range 16.7 m vs mean theory 22.6 m.
- As-built mass 0.85 kg vs 0.60 kg predicted (+42%). Launch height 1.75 m vs 2.00 m.
- After I stopped the left-wing launch assist, the path straightened and the last shots finally beat the mid-speed hole in the polar.
What broke
Flights 1–4 veered right. A launcher was holding up the left wing — I treated that as a failed test point, not a polar. We cut the assist, I added clay/tape for lateral trim, and flight 5 tracked straight. Experimental range σ = 7.98 m versus 1.49 m in theory (5×). The MATLAB model was not wrong so much as fed the wrong mass, height, and a contaminated launch. Rebuilding the polar on flight-day numbers is what made Rmax = 29.5 m readable instead of lucky.
MATLABNACA 6415Flight testDrag buildup
Full report